
USE WATERWAY CHARTS CORRECTLY
Navionics for Anglers: Which Charts and Apps Do You Need Today?
For electronic navigation and finding hotspots on the water, the Italian manufacturer Navionics is the best-known because it can supply charts to hardware (chartplotters) from various providers as well as mobile devices (phones and tablets). It is therefore rightly considered the market leader in digital nautical charts and fishing charts. Garmin acquired Navionics in 2017. Navionics now continues as a Garmin brand; charts for Garmin plotters and charts for compatible plotters from other manufacturers are offered as separate product families. The first joint Garmin-Navionics data product appeared in 2019. Today, you need to distinguish clearly: Garmin Navionics+ and Garmin Navionics Vision+ are intended for compatible Garmin chartplotters; Navionics+ and Platinum+ support numerous compatible models from other fish finder manufacturers. There is also the huge user base of the Navionics app on smartphones and tablets (Android as well as Apple iOS). The question remains: What advantages do Navionics charts offer us as anglers and boaters—and do we even need nautical charts for our favorite activity? We will answer that question later in the article. We also do not want to leave other frequently asked questions about Navionics unanswered.Table of Contents
Which charts does Navionics offer?
Navionics offers two product lines of waterway and nautical charts that differ in some features.- Navionics+
- Navionics Platinum+
How much does Navionics cost?
Back to the table of contents The price of Navionics charts depends first on the version (Navionics+ or Platinum+), second on the covered area (the world's waters are divided into different regions), and third on the access method (SD cards for chartplotters or the Boating App for mobile devices). The following figures and screenshots show our pricing as of April 2022. They are retained for comparison but are not a current price list. Always check today's price for your region and device directly with Garmin or in the app store.Historical SD card price examples (April 2022):
- Navionics+ and Garmin Navionics+: Regular size (€160) and extra-large (€200).
- Platinum+ and Garmin Navionics Vision+: Regular size (€250) and extra-large (€350).
Boating App: Price depends on region and platform
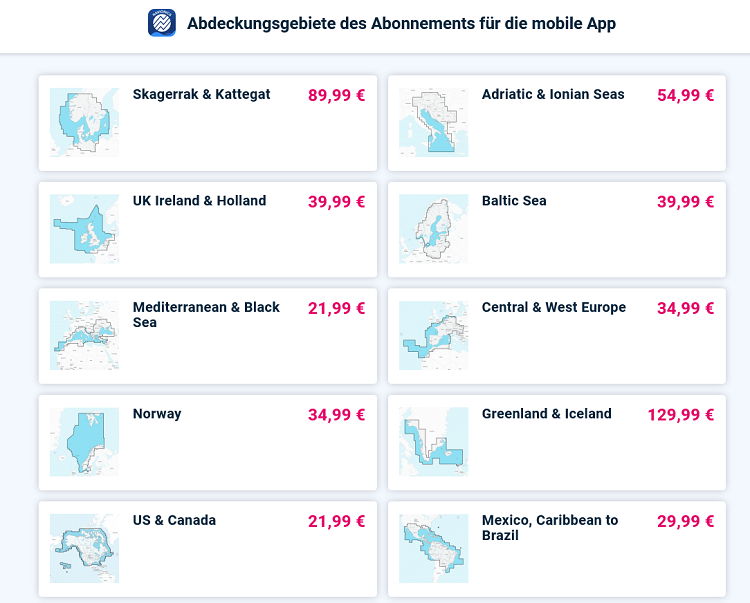
The price mainly depends on the selected region and purchasing channel. Check it directly in the Google Play Store, the Apple App Store, or with Garmin instead of relying on an old platform price. For example, we used the Central & Western Europe chart on our iPhones. In 2022, we paid €34.99 per year; the Skagerrak & Kattegat chart cost €89.99 per year at the time. These amounts reflect historical practical experience, not 2026 prices. Compared with what Navionics+ charts cost for fish finders themselves, the price is a joke. We had to pay a hefty €199 for the same chart for our Raymarine Dragonfly Pro 5. The app itself is installed through the Apple App Store or Google Play. After a limited trial period, charts and advanced features are unlocked through a regional subscription; Garmin shows the current details in the Navionics Boating App product overview.Is Navionics free?
Only to a limited extent. The Navionics Boating App can be installed for free and offers a limited trial period. An active subscription is required for chart downloads and continued use of detailed charts. The former free Navionics Chart Viewer was discontinued; its address redirects to the Garmin Marine Chart Viewer.
Important: Since version 20.0, newly downloaded charts have different access rules than those described in the old article. Therefore, before buying or traveling, do not rely on previous subscription terms; check the current status in your Garmin/Navionics account.
How do I update Navionics?
Back to the table of contents GPS charts for chartplotters are updated with the “Chart Installer” software in 3 simple steps:- Download “Chart Installer” to your computer and install the program.
- Connect the Navionics SD card to the computer and open “Chart Installer.” For blank memory cards, make sure update mode is enabled.
- Select the layers you want to update. The system displays the estimated download time and expected storage use. Click “Start.”
Can Navionics be used on multiple devices?
Back to the table of contents With GPS charts, this is very easy: simply move them from one fish finder to another. The Boating App can be installed on compatible Apple and Android devices. How many devices can be used simultaneously through the same store and Garmin/Navionics account depends on current platform and account rules, so we no longer present the previously stated fixed numbers as a current guarantee. Every region you purchase is stored in your Navionics account and can therefore be restored in the app on any other mobile device. Simply download the Boating App and sign in with your credentials (email and password). Once signed in, your coverage areas/subscriptions and favorites (markers, routes, tracks) are restored. You can review your purchases and subscriptions by going to Menu > Profile (Your Name) > Subscription. If they are not available there, simply select the “Restore Purchases” button farther down the screen.Tips for Buying Navionics Charts (Decision Guide)
Back to the table of contents a) Chartplotter or Boating App on a mobile device? First, it is a question of cost. If you already have both a plotter and a tablet, chart prices for the former are considerably higher. The same applies to the added cost of updates. However, the lower chart price comes with smartphone and tablet hardware poorly suited to these applications. Neither device is generally designed for outdoor use. Only chartplotters offer water protection and a sunlight-readable screen. Mobile devices also have poor battery reserves for long fishing days. Handling is also awkward if you want to use a fish finder alongside one. A plotter combination unit is considerably more convenient. Nevertheless, under certain conditions, a smartphone/tablet solution is recommended for more than just backup for plotter operation. Here is ourTip 1: Before buying, use the limited trial period currently offered for the Navionics Boating App. Check not only whether your body of water is included, but also how detailed the depth contours are in the exact area you want to fish.
b) Should you buy “small” or “large” coverage for Navionics Charts? In our 2022 price comparison, the difference between the two sizes was around €100, and around €50 for updates. If in doubt, we would still recommend the smaller version if its coverage is sufficient for the waters you fish. However, you need to check today's additional cost again.Tip 2: If you use nautical charts only once a year for a short fishing trip, the Boating App on a smartphone at least 5 inches in size—or preferably a 10-inch tablet—should be sufficient for cost reasons. You always have your phone with you anyway, and a small suction-cup mount from your car is usually enough to attach it to the boat.
c) Is the higher price of the Navionics Platinum+ chart version worth it? In our comparison at the time, 3D charts were reserved for plotter operation. The added cost in 2022 was around €100. The deciding factor remains whether Relief Shading, aerial imagery, and additional views truly help you analyze a specific body of water; today, you should recheck the features and price for your chart product. You can assess chart information without a 3D view, even though it is considerably more informative in three dimensions. Anglers can also do without satellite and panoramic images, although these are much more important for larger vessels when mooring.Tip 3: Regardless of your plotter setup, you should always have the Boating App installed on your smartphone with all the areas you currently fish. It is virtually essential as a chartplotter backup, and when you are traveling on someone else's boat, it provides an extra measure of safety.
Navionics Charts for Chartplotters
Back to the table of contents Navionics+ and Platinum+ are available for many compatible chartplotters from major manufacturers, including, depending on the model, Lowrance, Simrad, Humminbird, and Raymarine. Always check the specific model and chart compatibility before buying. Moving a memory card between devices makes sense only if the chart product, storage medium, and specific plotter model are compatible. Having the same card slot does not automatically mean the same charts are supported. Current compatible Garmin chartplotters use Garmin Navionics+ and Garmin Navionics Vision+. According to Garmin, Navionics+ and Platinum+ products for other brands are not intended for Garmin chartplotters. Plotter navigation works offline. Internet access is required only for chart updates.Do I even need nautical charts for fishing?
Anyone who owns a combination fish finder or a separate chartplotter will- regularly travel by boat and
- certainly fish more than just the local carp pond.
- This begins with safely navigating the fishing area,
- continues with heading directly to hotspots,
- reliable orientation in poor visibility,
- and extends to easily finding productive fishing spots again.
How to Find Fish with Navionics Charts
Back to the table of contents Unlike fish finders, nautical charts cannot see underwater, nor do they mark catch locations. Fish are always moving and roaming in search of productive food sources. So it makes sense to find exactly those places where currents carrying food can be expected under certain conditions. Fish populations will naturally gather there at certain times. Experience tells us that as the tide rises, transitions from deep to shallow water in all kinds of configurations—rising channels, edges, breaks, plateaus, underwater mountains, and so on—magically attract fish. First come schools of baitfish, followed by predators such as pike. To find such places, you simply need to study the depth contours of your target area on the fishing chart. This makes it easy to identify promising fishing spots before the trip. It follows the old saying, “Only those who know where the fish are will catch them.” You can then mark the potentially productive spots on the chart by adding waypoints and approach them precisely using the “Navigate To” command.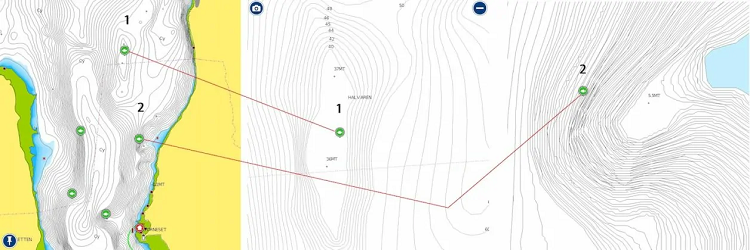
What happened to the Navionics web app (Chart Viewer)?
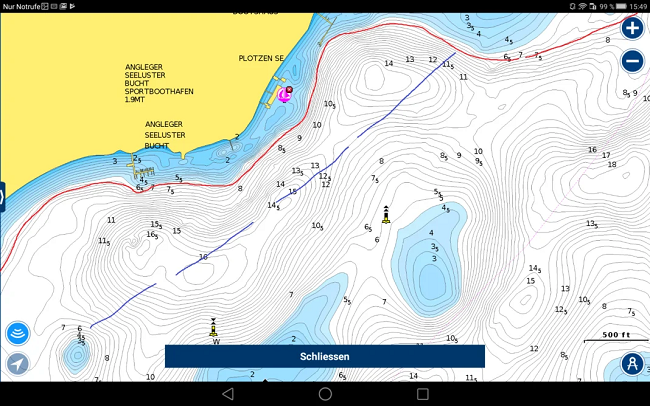
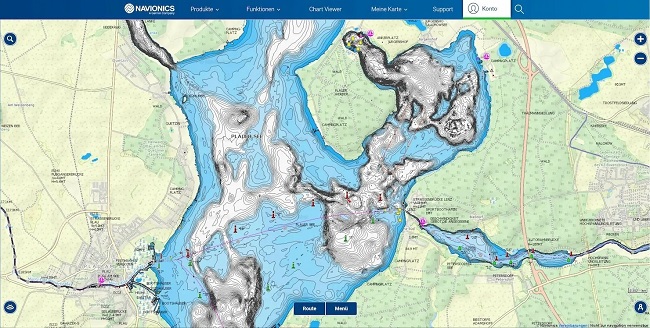
Back to the table of contentsThe former free Navionics Chart Viewer was discontinued. The old webapp.navionics.com address now redirects to the Garmin Marine Chart Viewer. There you can view charts on a computer and check regions, but the interface and available features are no longer the same as in the former Navionics web app.
How do you plan today on a computer or mobile device?
For an initial check on a computer, use the Garmin Marine Chart Viewer. For detailed HD bathymetry, SonarChart maps, waypoints, routes, and use on the water, the current solution is the Navionics Boating App on iOS or Android.
The fishing principle remains the same as in our original test: Before your fishing day, search for edges, underwater mountains, channels, plateaus, and transitions, mark the most likely areas, and later check them on-site with a fish finder and your own observations.
Navionics also offers extremely informative and helpful online seminars. In them, fish finder experts show how to use waterway charts properly. This means you are guaranteed to find the best fishing spots—whether in summer or winter. Lowrance is also a regular partner in Navionics webinars. Because the seminars take place during evening hours in the US, it is usually already 1 a.m. here. That is tough, but in our view, time well spent. The presentations are in English, but always include slides. If needed, you can translate them afterward using screenshots. Most webinars are also subsequently uploaded to the Navionics YouTube channel. Some are even in German.Boating App: Mobile Nautical Charts for Smartphones and Tablets
Navionics first offered the Boating App for smartphones and tablets in 2008. From then on, it underwent various program changes and name changes with different objectives before being completely redesigned in 2018. Today, the application is called Navionics Boating. You can install it from the Google Play Store for Android or the Apple App Store for iOS and sign in with a Garmin/Navionics account. Installation alone does not permanently unlock all charts. After a limited trial period, you need an active subscription for the desired coverage area to download detailed charts and use advanced features.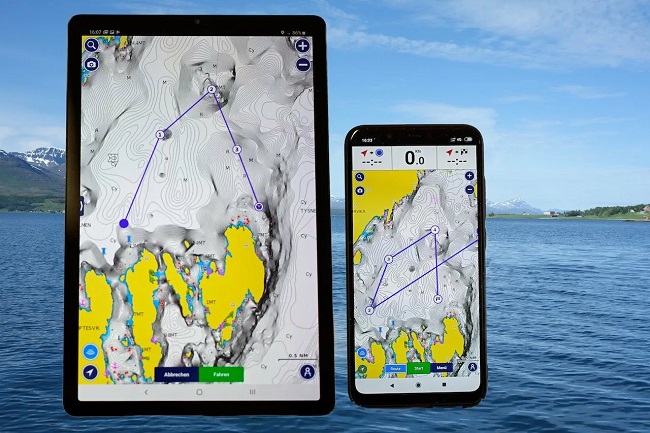
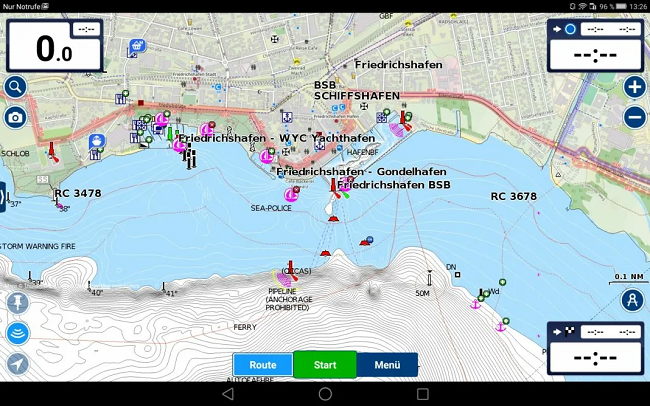
Which charts does the Boating App use?
Back to the table of contents It uses Navionics+ charts, just like GPS charts for plotters. This means smartphones and tablets have access to the same high-resolution nautical charts with the same functionality. The standard functions, including Autorouting and Community Edits, are included, making its application profile comparable to a chartplotter. Platinum+ versions are reserved for those devices, however, so a 3D option is not available on your mobile device.Why still use a chartplotter?
The key issue with smartphones and tablets remains the hardware: Not every device can be operated reliably in sunlight, moisture, heat, and with wet fingers. Power supply must also be considered for a long fishing day. You can, of course, make hardware accommodations if you want to take a tablet onto the water. However, it is not the most elegant—or comfortable—solution.Learn more here about fish finder batteries and rechargeable batteries.
Is all downloaded chart material stored on the smartphone or tablet?
No, because the complete chart collection would overwhelm the mobile device's storage and significantly slow the application. You therefore download only the chart area you currently want to use. Within the paid region, this is free of charge. If you need a new fishing area, simply download it and delete the old one when it is no longer needed. This is both efficient and storage-saving. The app also works offline, of course, but the body of water you are currently fishing must be stored on the device.Which Navionics chart should you choose for Germany?
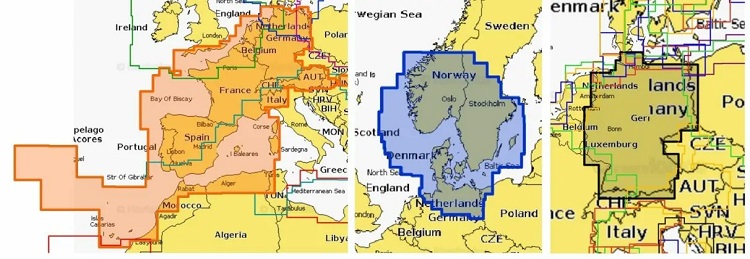
Back to the table of contents Choose the chart carefully. One option is for northern Germany and northern Europe, including Denmark, the Baltic Sea, and southern Norway. It is called “Skagerrak & Kattegat.” However, if you mainly travel in southern Germany, you should choose the “Central & Western Europe” chart. It extends across France, Austria, Switzerland, and northern Italy, all the way down to Spain.Can you create your own charts with SonarChart Live in the Boating App?
As surprising as it sounds—yes, you can. Of course, a smartphone or tablet does not have a built-in fish finder that can determine depth contours. However, an external device can be connected wirelessly. Unfortunately, this does not work with every model. However, many internet-enabled devices from Lowrance, Simrad, and Raymarine are compatible, so nothing prevents you from using Navionics SonarChart Live with them.Which smartphones and tablets are suitable for the Navionics app?
- Apple devices: iOS 16.0 or later (as of August 2026).
- Android devices: Android 10.0 or later (as of August 2026).
What advantages does the Boating App offer?
Back to the table of contents You probably always have your smartphone with you when fishing anyway. Our solution is to use waterproof cases for our iPhones on the water. We use them to display our current position on the selected route. We use the fish finder for the sonar and DownVision displays. Because we do not want to spend 1,500 EURO on a huge display, this gives us the full flexibility of the three different displays. Additional advantages of the Marine & Lakes app:- Whether or not you are traveling by boat, you can plan your fishing trip precisely.
- You always have a local, up-to-date fishing chart with you on every vacation!
- If you use a Lowrance, Raymarine, or Garmin fish finder, you can synchronize the SonarCharts with your smartphone, because their display is supported.
Ultimately, this means a tablet could even function as a stand-alone plotter with Navionics+ charts, or as a second screen for a sonar unit. That's something, isn't it?
How do navigation and hotspot searches work in the Boating App?
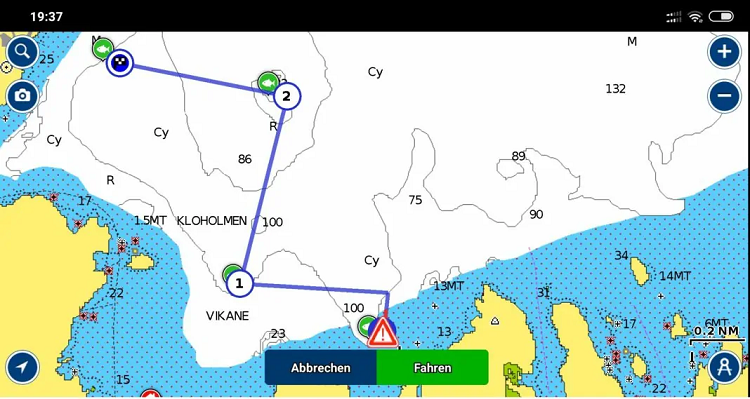
Back to the table of contents Only a few steps are required to navigate directly to a particular hotspot.- First, create and save waypoints for the hotspots.
- The plotter numbers the trackpoints in the order they are entered. You can enter them either by coordinates or simply by marking them on the screen.
- You can now—but do not have to—use the waypoints to define a route.
- To navigate to a waypoint or along a route, then select the navigation command in the menu.
- The plotter then displays the start-to-destination line (direct course), and you can set off immediately.
Our Experience Using Navionics While Fishing in Norway
Back to the table of contents In the test, we used Navionics Platinum+ Norway North-West (11P+ Large) with a Lowrance HDS-7 Carbon fish finder, although an HDS from the Gen3 series would presumably deliver similar results. As a team that knows exactly how to create its own MAP—we have had a fishing chart for Norway based on our own data for years—we were initially skeptical about the value for money offered by Navionics charts. We still are, because at such high prices—plus the cost of a decent GPS fish finder—we cannot imagine these products truly being major sellers. Most often, fish finder beginners (German-language course) ask us in the TACKLEFEVER forum about entry-level units under €500. Semi-pros ask about the next category between €500 and just over €1,000. Often, there is no budget left to buy an additional fishing chart. However, the main focus here is on technical facts about practical use, with the purchase price coming second. To say it upfront, most of our technical doubts were dispelled. At least the catches made by our lead tester Jörg spoke for themselves—but more on that later in the article.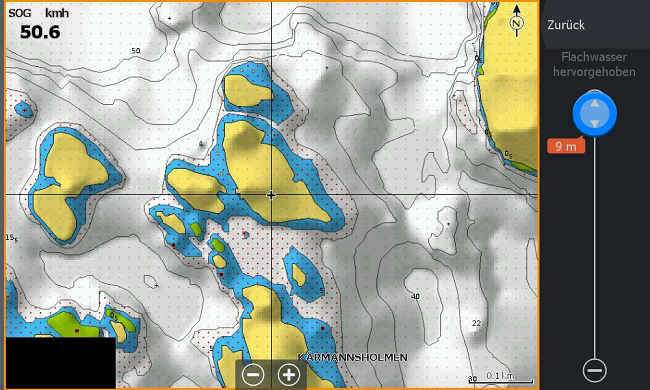
One interesting side note should not go unmentioned: You can use SonarChart Live to generate data not only within the Platinum+ chart's coverage area, but also outside it—in other words, on any body of water here in Germany as well.
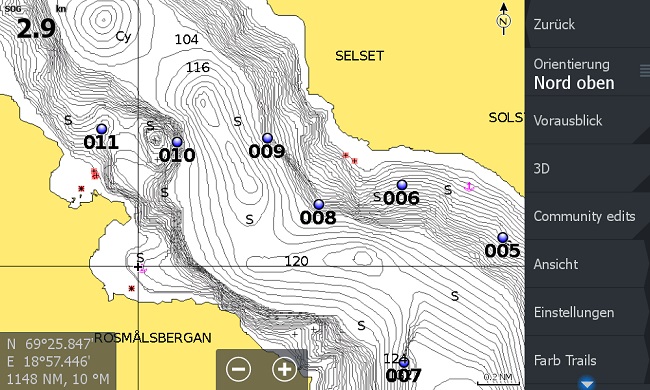
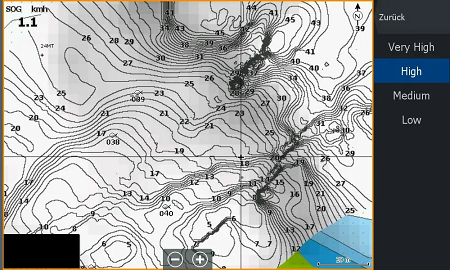
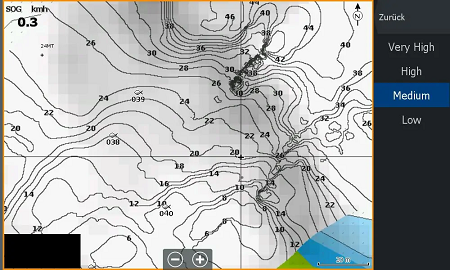
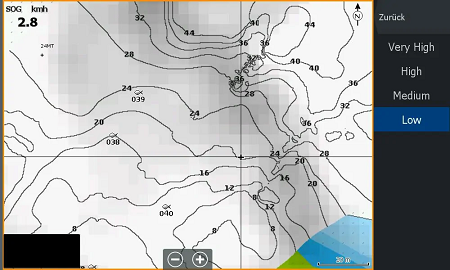
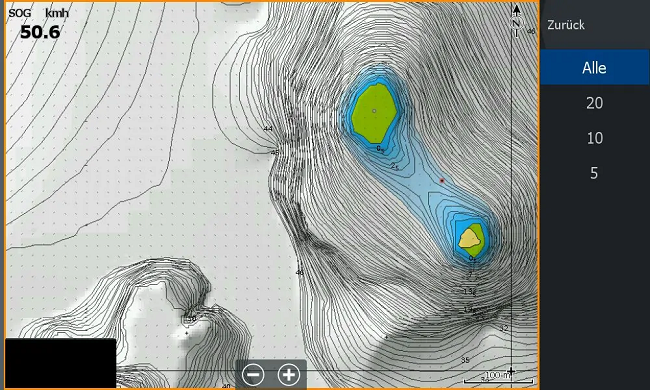
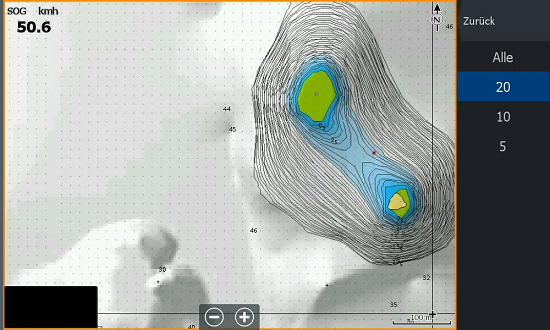
You can also view the generated charts on your home computer. Of course, this works only if it has a GPS fix. Simply take the unit outside briefly, acquire the satellites, and you can zoom in on the overlay. The user data suggest that SonarChart Live uses a tile structure, which may indicate that data could be exchanged by copying it to another suitable Navionics chart. (That test is currently underway.) But enough dry-dock theory for now; let's finally get moving and onto the water. We want to show you a few images that Jörg recorded during the test in Norway. The following 4 screenshots show the same area with different SonarChart Live settings: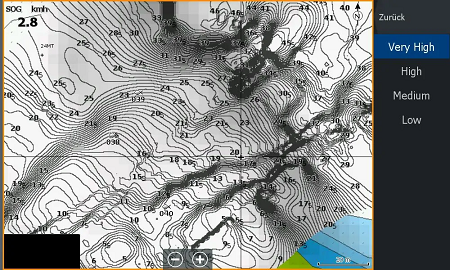
Explanation: What is interpolation?
A few more words about interpolation, the process that ultimately creates the depth contours: The underlying raster interpolation remains invisible, but the depth contours are actually generated from it. Although Navionics keeps the exact method secret, one might infer that it uses kriging. The resulting band of depth contours extends 20 m on either side. That is a substantial distance for a line of precisely vertical data. It follows that, if possible, you should create the next parallel track less than 20 m away—preferably 10 m or even closer—from the existing track. This will often not really be possible in practical use, resulting in the familiar gaps in the charting. So if you have logged a certain area, you need to know that all data at the edges should be treated with caution because they effectively lack an interpolation partner. The same applies to shoreline areas, because SonarChart Live does not interpolate toward the shore, even if shorelines are present and displayed in the original nautical chart and would actually be suitable for this purpose. Thus, SonarChart Live behaves similarly to AutoChart or Quickdraw at present. Interpolation toward the shore is presumably performed by Navionics only after the data have been submitted, with the result then made available through an online update, similar to C-MAP Genesis.How do SonarChart Live, Garmin Quickdraw, and Humminbird AutoChart Live differ?
Back to the table of contents From a competitive standpoint, our assessment is as follows:- Humminbird's AutoChart Live seems better than SonarChart Live, partly because it uses color.
- SonarChart Live seems better than Garmin's Quickdraw because the chart is created immediately—in other words, live. Also, and this is very important to many people, it uses meter values rather than feet.
- Navionics and Navico could quickly catch up with or even overtake their competitors if they overcome the limitations mentioned.
What exactly is meant by the reference to colors?
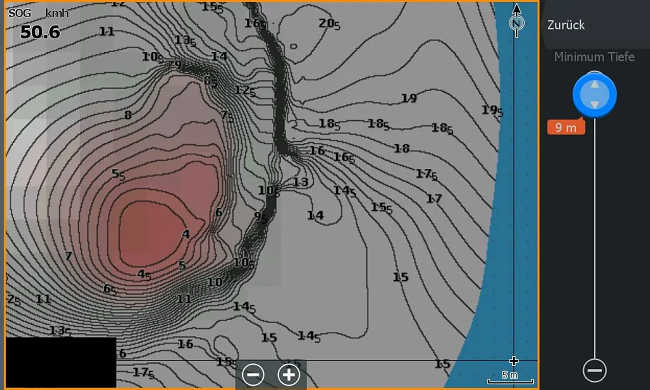
The SonarChart overlay is usually created as labeled black lines on a white background, without transparency settings. The “SonarChart Live Options” settings can be used to create graduated red depth zones in shallow water. In principle, this helps with orientation. However, in our assessment, the number of available colors and color palettes could still be improved.Lowrance HDS fish finders should technically be capable of much more!
How long does a Navionics Chart Installer update take?
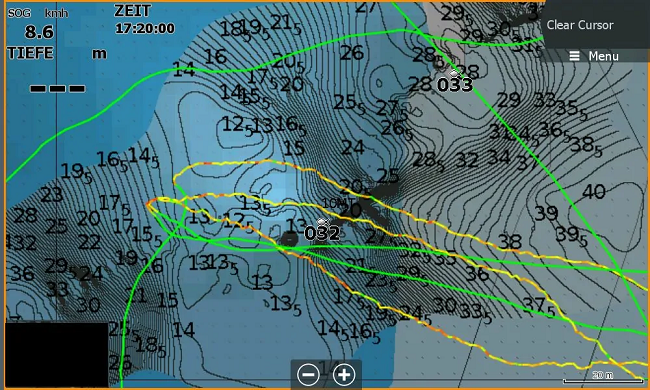
Processing the chart update after submitting a correct GPX file containing depth values should take about one week. One problem with very large charts such as “Norway North-West” is that only a complete update is possible, and it is just under 2 GB in size. Why the system does not check tile by tile to determine what can remain and what needs to be added to the MAP remains a mystery. Perhaps this is due to an internal data structure. We do not know the answer. These small and large technical problems prompted us to record log data as SL2/SL3 as well, so that we could later process them in ReefMaster however we preferred. The additional log recording worked flawlessly during the test and ran simultaneously with SonarChart Live. But we kept asking ourselves: Why doesn't Navico unlock the live-generated MAP option for higher-priced units instead of limiting it to a combination with purchased Navionics charts? In our opinion, this represents a significant competitive disadvantage compared with competitors such as Garmin or Humminbird. They offer similar functions free of charge, or at least at a much lower cost. We can only speculate that patent, technical, or simply “know-how” considerations may play a role. It seems as if Navico merely licensed and uses Navionics functions and libraries without making any effort to develop these capabilities itself and integrate them into its units. Garmin has since fully acquired Navionics. Our assumption at the time therefore reflects the historical status of the test; whether and which live-mapping functions a unit now offers without an additional chart must be checked for the specific model and current software. A link to the now-spun-off “C-MAP Genesis,” for example, would be conceivable. It could take the form of a premium subscription to cross-subsidize the whole arrangement. The best option, of course, would be to provide it free of charge—we can still dream. :-) Now, back to the test: The new “Color Track Lines by Speed Over Ground” function proved particularly useful on the HDS units. It shows very clearly which areas have already been fished and which have simply been crossed. This is extremely helpful when setting up a new drift.One disadvantage of SonarChart Live should also be mentioned: If you hide the relevant track or create a new one, the color gradations disappear and only a single-color line remains. Navico may need to make further improvements here to preserve the information permanently.
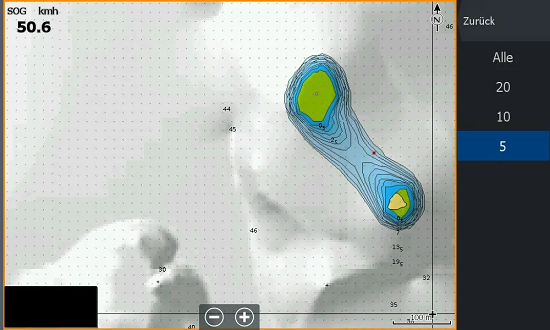
Navionics SonarCharts: Additional Settings
Back to the table of contents We will now demonstrate additional settings and their use with the navigation chart and its coarse depth contours.The “Shading” option
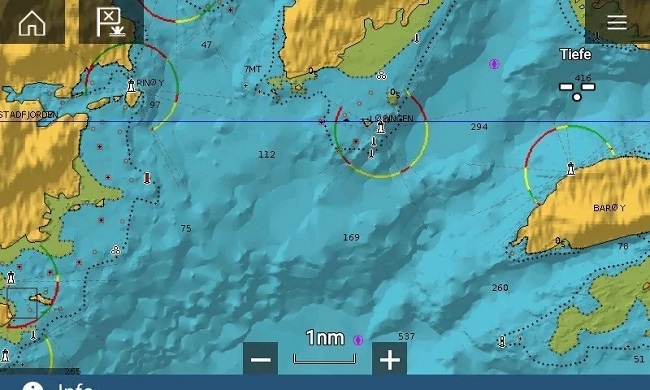
“Shading” is an extremely important option, especially for anglers fishing near shore or in shallow water. It is a translucent or transparent overlay that ReefMaster users will recognize as Shaded Relief. In principle, it treats an underwater mountain as if it were above water and casting a shadow in the sun. This is a common GIS element that greatly enhances the visual impression of terrain.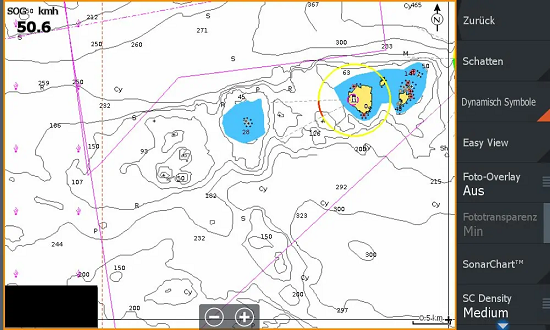
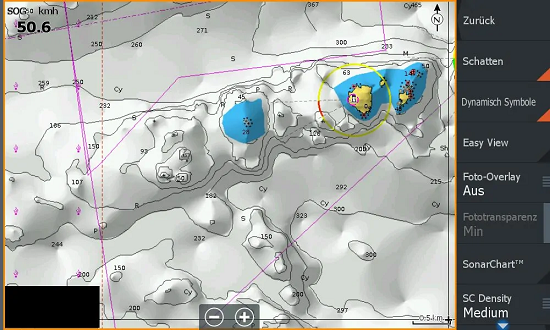
The “Safe Depth” option
Another important element, especially for shore anglers, is the “Safe Depth” option. Although it was originally intended for safety, it also provides an indication of interesting fishing grounds.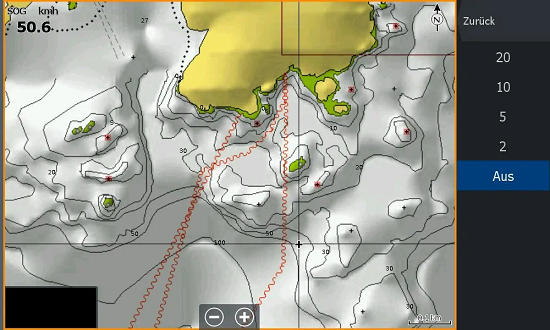
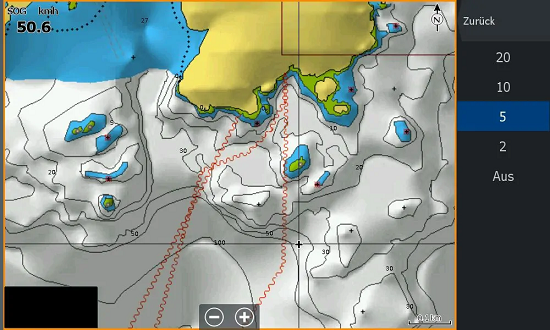
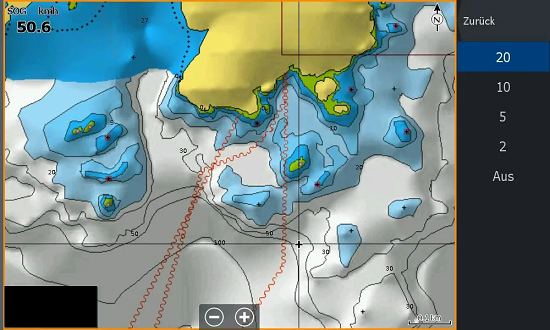
The “Tides” option
Tides play a major role, especially in Norway. Unfortunately, we forgot our smartphone one day and could not use our beloved “Tides” app. In this situation, however, you can search the chart for tide stations and use their data.The “Aerial Imagery” option
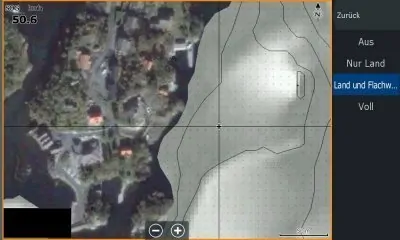
Because we know very well that aerial imagery cannot easily fit on an average memory card due to its storage requirements, we were curious how Navionics solves this problem. The answer: “Simply use only two levels.”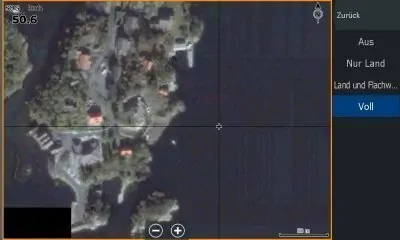
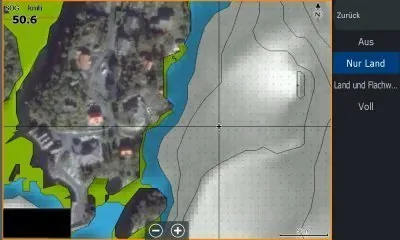
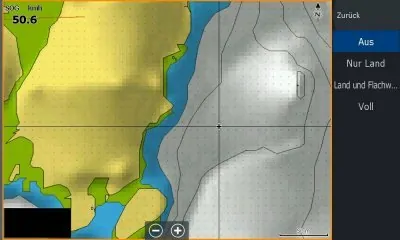
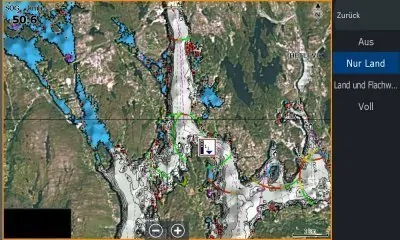
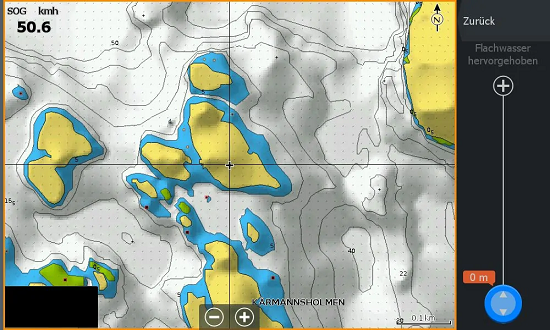
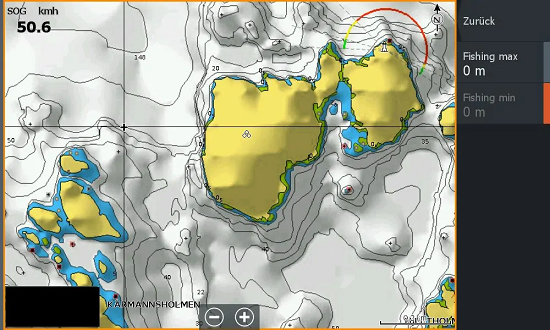
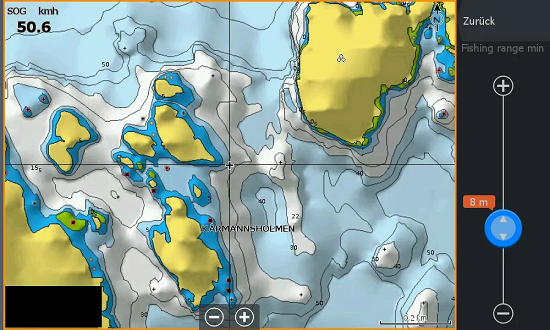
The “Depth Highlight or Fishing Range” option
The “Depth Highlight” mode is familiar from inland waters in Germany and is already supported by various chart programs and GPS fish finders. Accordingly, Navionics has also integrated it into its charts under the name “Fishing Range.”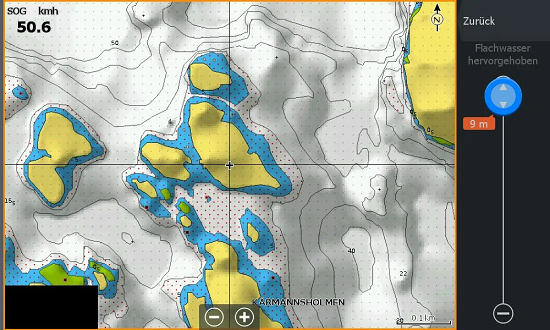
The “3D Maps” option
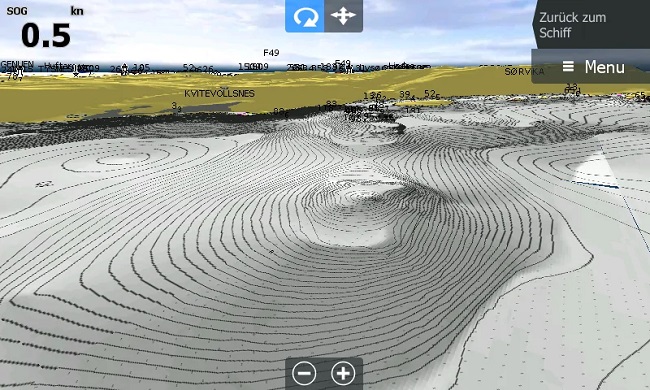
The same applies to the 3D option. It seems suitable to us only for navigation, although the 2D chart works just as well for that. Other options such as radar may be different, but for practical fishing, its usefulness seems rather limited to us. This may also be because the artificial vertical exaggeration cannot be changed, even though this is easy in other GIS applications. Shallow areas therefore appear quite flat.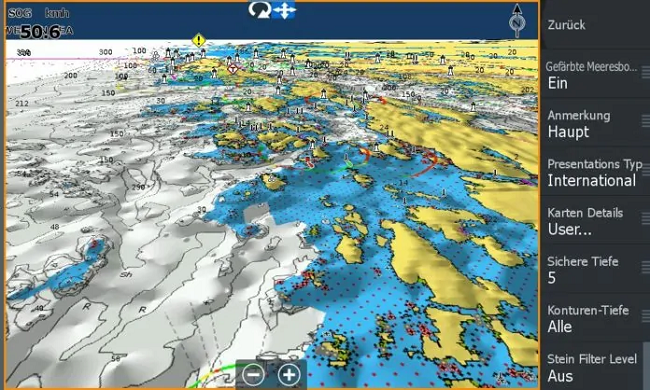
Conclusion: Fishing in Norway with Navionics Nautical Charts
Back to the table of contents Overall, the Navionics Platinum+ chart for Norway adds value when combined with newer HDS fish finders. However, users can benefit from it only if they are willing to pay the hefty price for the chart material. Of course, Navionics also offers less expensive charts with the same features but smaller coverage areas than the one tested here. Its usefulness comes primarily from- very useful settings for depth ranges,
- several thematic charts and overlays,
- and above all the Shading and SonarChart Live features.
- The chart material as a whole is also very helpful because it actually shows underwater structures that other chart manufacturers cannot provide.
However, both agree that if Navico integrated live mapping without Navionics, there would be no need for another unit or the Navionics MAP. The money could be better spent on a larger screen, for example. The paid Navionics chart would then be reduced to its display of specific areas and would be compared with other offerings without any special functions.