
GPS, NAUTICAL CHARTS & UNDERSTANDING THE WATER
What Is a Chartplotter—and How Does It Help You Find Better Fishing Spots?
Anyone who uses a fish finder knows the problem: You pass over an interesting drop-off and see baitfish, a hard bottom transition, or a striking line. On your next visit, the area is almost impossible to find again without a reference point. A chartplotter does not save the catch—it preserves the observation. Over time, that creates a personal picture of your fishing water.
This article is based on the existing in-depth chartplotter guide and follows its practical approach. Outdated prices and previous device suggestions were deliberately not carried over as supposedly current buying recommendations. For specific equipment decisions, see the regularly updated fish finder and chartplotter comparison; this article focuses on actually using the system on the water.
What Is a Chartplotter and How Does It Work?
Digital nautical charts contain extensive data: depth contours, buoys, shoals, channels, shorelines, harbors, and, depending on the chart, other information. The chartplotter processes this data for the selected map area. You can zoom in, pan the chart, and ideally identify the exact depth or shape relevant to your current search.
At its core, the system resembles a tablet with a clearly defined purpose: a weatherproof housing, a display designed for sunlight and spray, a GPS receiver, and charting and navigation software. Ruggedness is not the only key difference from a phone. While drifting, underway, at different zoom levels, and over extended periods, the plotter must perform reliably as part of the boat's systems.
For anglers, its value begins when a chart raises a question: Which contour connects shallow water with deep water? Where does a bay connect to a channel? Along which drop-off might baitfish move from open water to structure? The chart does not provide a definitive answer. It gives you a more informed basis for your search.
How Exactly Does GPS Work on a Chartplotter?
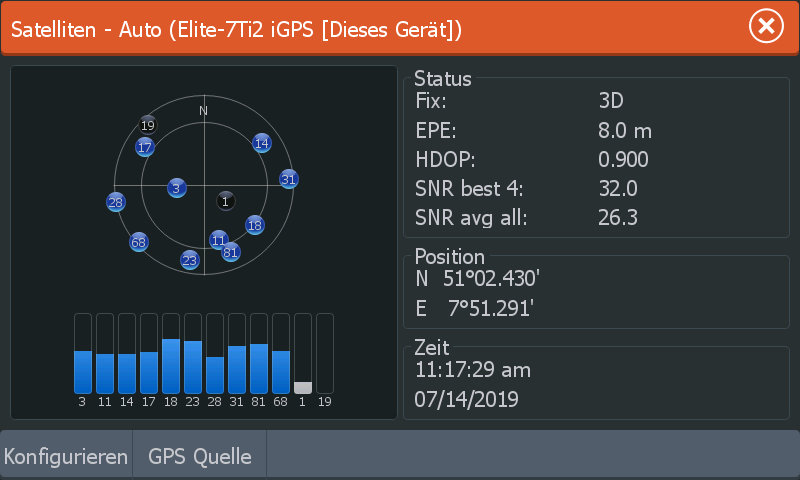
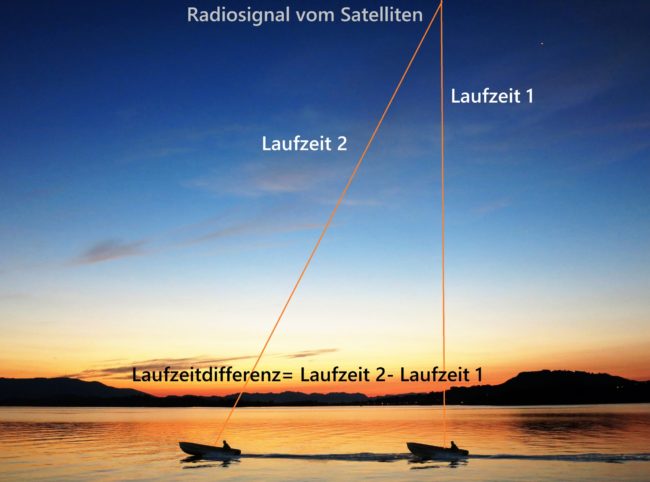
GPS was originally developed for military purposes and is now freely available to civilian users. A satellite continuously transmits its position and extremely precise time information. The receiver calculates distance based on the signal's travel time. Combining signals from multiple satellites makes it possible to determine its own position.
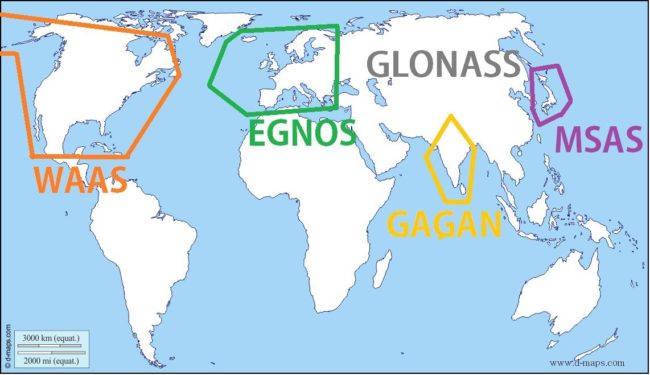
In Europe, satellite-based augmentation systems such as EGNOS help correct common signal errors. The atmosphere, reflections, and the receiver's clock can affect measurements. Under good conditions, the position display is very accurate. Nevertheless, realistic expectations are always essential on the water: GPS does not know about a newly placed buoy, a log, or changes caused by a storm.
In addition to position, a chartplotter displays speed and course over ground. Course over ground can only be determined through movement. Additional sensors, such as a true compass or heading sensor, can therefore be useful for precisely aligning a stationary boat or navigating safely in difficult conditions, depending on the boat and intended use.
How Do GPS Data and Digital Charts Work Together?
Imagine a paper chart and a small point of light. The light is your boat. As the boat moves, the point moves across the chart. A plotter does exactly that digitally: It can scroll the chart, change the zoom level, and save the path traveled.
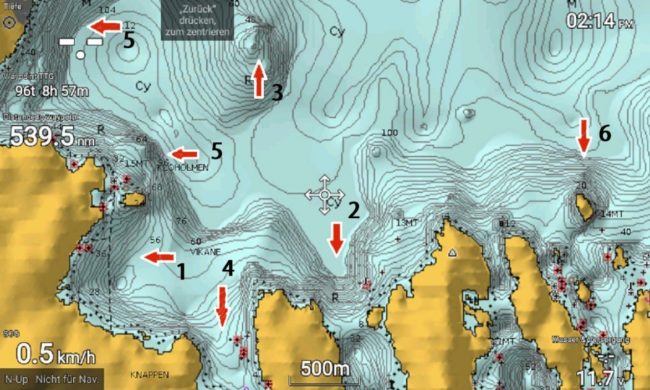
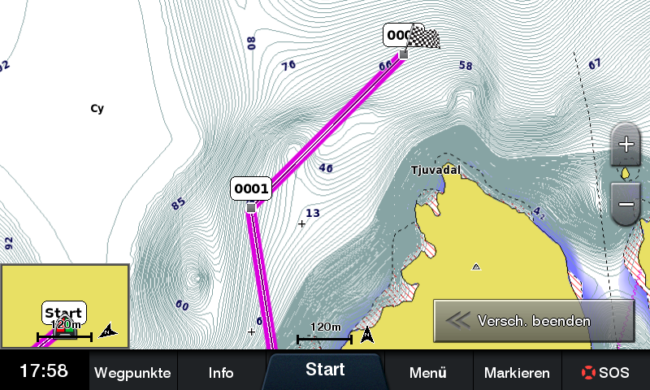
The display varies depending on the chart type. Bathymetric depth contours are especially valuable when searching for fishing spots. They reveal where water becomes shallower or deeper, where plateaus end, channels converge, or a steep drop-off begins. A chart is not a sonar image, nor is it guaranteed to be accurate to the centimeter. It provides the overview you use to select promising areas before checking them on the water.
How Do Waypoints, Routes, and Tracks Help on the Water?
Waypoints are your memory on the water. Do not indiscriminately mark every fish arch. Instead, mark a specific observation you can understand later: a transition from gravel to mud, the first weed edge, a drop-off with baitfish, the beginning of a productive drift, or a spot you want to check again with a different wind direction. Meaningful names make a difference: “18 m / hard drop-off / bait” will be more useful later than “WP 128.”
Routes connect waypoints to form a plan. On a large lake, this might be a search path across a plateau; in a fjord, a drift along a drop-off. A plotter can guide you to a destination or suggest a course. Responsibility always remains with the boat operator: The chart, traffic, weather, visibility, and actual obstacles must be checked on site.
Tracks record your actual path. They show whether you covered a line cleanly and let you repeat a drift later. A backtrack can provide important additional guidance, especially when fog develops quickly or visibility is poor. Tracks are recorded automatically and should be organized regularly—otherwise, too many lines will eventually clutter the chart.
Why Are Good Nautical Charts More Important to Anglers Than a Large Screen?
On land, a navigation system follows established roads. There are no such roads on the water. Good charts are therefore essential safety equipment on larger bodies of water and especially in saltwater. They also provide something crucial for fishing: They make the shape of the water readable before you have traveled for even a minute.
The charting landscape has changed since the original article. Garmin, Navionics, C-MAP, and manufacturers' proprietary systems offer different charts, coverage, and licensing models. Before buying a device, therefore, always check which chart is available for your specific body of water, which device supports it, and whether recurring costs or updates are involved. The detailed article about Navionics and fishing maps explores this decision in greater depth.
When finding fish, do not read charts as a promise. A sharply defined drop-off may be interesting, but it does not have to be active. A less pronounced area may become productive because of weeds, baitfish, light, wind, or the season. The chart narrows a vast expanse down to plausible zones. Your fish finder and observations verify them.
How Do You Use a Chartplotter to Find Fish in Practice?
How Do You Plan a Day of Fishing on New Water?
Before setting out, do not look for ten hot spots. Choose two to four areas based on a clear question. Examples include a shallow bay connected to a deep channel, a plateau with a nearby drop-off, or a transition where the wind might concentrate baitfish. Set preliminary waypoints and decide on the water which areas warrant further investigation.
You then follow a search line rather than wandering aimlessly. Use the fish finder to observe whether the chart matches reality: Where does the drop-off actually begin? How are the weeds positioned? Are there hard bottom transitions, mussels, wood, or baitfish? Only then should you mark the area you want to find again.
How Does a Chartplotter Help When Fishing for Pike, Perch, and Zander?
When fishing for pike, weed beds, shallow bays, open-water drop-offs, and connections to deeper water can structure your search on the chart. When fishing for perch, plateaus, drop-offs, areas with baitfish, and transitions are useful. When fishing for zander, channels, hard-bottom areas, ledges, and repeatable drifts become more important. The target species changes the search question, not the basic logic: First narrow the search to the most likely area, then fish it properly.
What Are the Benefits of Live Mapping or Creating Your Own Depth Maps?
To create your own maps, you need at least a GPS receiver and a fish finder that measures depth. As you travel, the measured depth is assigned to the current position. Depth contours and bottom shapes gradually take form. The more systematically you run your lines, the more useful the chart becomes.
These systems have different names depending on the manufacturer: Garmin uses Quickdraw Contours; Lowrance and Simrad use Genesis Live; Humminbird uses AutoChart Live; and Raymarine uses RealBathy. The basic idea is the same. The chart does not replace official navigation charts or caution. It makes your own knowledge of the water visible.
Discipline pays off when mapping: Run overlapping lines, keep your speed and course constant whenever possible, and record unusual features. When water levels change or seasonal weeds are dense, a chart is always partly a snapshot in time. That is precisely why it is valuable: You can compare it later to see what has changed.
Which Chartplotter Is Right for Your Boat and Fishing Style?
A chartplotter should reliably perform three primary tasks: display the chart legibly in sunlight, accurately manage your position and observations, and suit your fish finder setup. Anglers who regularly search large expanses of water often benefit from having SideScan, charts, and waypoints in one system. Anglers using a small boat or kayak must balance screen size against power consumption, mounting, and visibility.
- Charts first: Are useful charts available for your body of water, and is the device compatible with them?
- Search style: Do you primarily want to navigate, systematically scan areas, or add live sonar later?
- Display and controls: The chart must remain legible and the controls usable in sunlight, wind, and with wet hands.
- The system, not just the device: The transducer, power supply, mount, charts, and potential expansions are all part of the decision.
Current models, functions, and technical specifications can be found in the 2026 fish finder test. There, we compare devices by application rather than as a rigid ranking. This chartplotter article remains the fundamentals and practical-use article, so the pages do not compete for the same search intent.
Frequently Asked Questions About Chartplotters for Fishing
Do I Need a Chartplotter If My Fish Finder Has GPS?
A device such as the Garmin Striker can already accomplish a great deal with GPS and custom depth maps. However, full chart functionality and more extensive planning require a chartplotter platform. The Striker Vivid review demonstrates this distinction using a specific device.
Can a Chartplotter Show Fish or Hot Spots?
That is precisely why it is so useful: It prevents you from starting from scratch every time you fish. You can return to a marked area and check it during a different season, wind direction, or water level.
Can a Tablet Replace a Chartplotter?
The best solution depends on the boat. A tablet can be an affordable addition, but it should not be assumed to be waterproof or fail-safe for navigation.
The Most Important Rule for Fishing with a Chartplotter
A chartplotter does not guarantee a catch. But it gives you something far more valuable: a logical starting point, a record of useful observations, and the ability to learn more systematically from every day of fishing. That saves time on the water—before you make your first cast.