
UNDERSTANDING REAL SONAR IMAGES
How to Read Sonar Images Correctly: How Do You Interpret Fish, Bottom, and Structures?
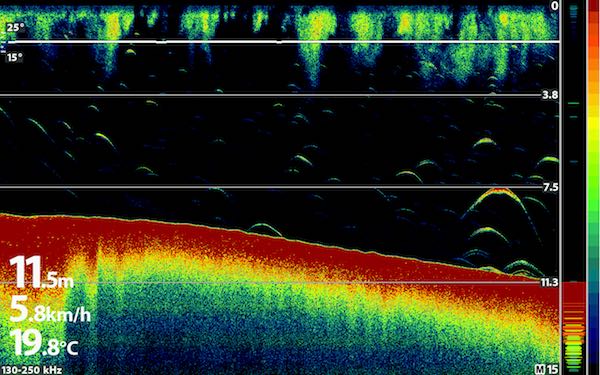
In the following article, we want to show you how to correctly interpret and analyze your sonar images. Many boat anglers choose a fish finder to locate fish and hotspots faster. But disillusionment sets in shortly after the expensive purchase, because very few fish finder images are easy to interpret at first glance. Beginners often have no idea what to make of the images and travel kilometer after kilometer before their rods even touch the water. That makes it all the more important to educate yourself so you can find fish faster and have more time to fish.
“90% of the fish are found in 10% of a lake's area.”
(Carl Lowrance)
The problem is that most fish finder manufacturers fail to provide important and, above all, fundamental information about interpreting sonar images. They rave about frequencies, DownScan, CHIRP, or whatever else and promote every conceivable technical detail so customers are encouraged to buy the most expensive model possible.
And then? Well, that is largely the end of the support ... Now you are responsible for finding information yourself ... somewhere in forums or social media groups.
Can we change that? Certainly not the manufacturers' approach. But in this article, we can show you how even basic knowledge can help you analyze and interpret your sonar images much better. After all, the best fish finder is useless if you do not know how to interpret its images.
Table of Contents:
- Basics of how a fish finder works.
- CHIRP vs. Non-CHIRP
- Photorealistic Images
- Can GPS help you find hotspots faster on unfamiliar waters?
- SideScan—or: “Where exactly is the fish really located right now?”
How Are Sonar Images Created in the First Place?
First, we would like to briefly explain the basics of how sound works underwater. The fish finder's transducer sends, or pings, a sound into the water. It spreads spherically in all directions, although fish finder manufacturers have managed to focus the sound and direct it particularly strongly in one direction—for example, downward with a 2D transducer.
As soon as the sound wave hits an object (bottom, rock, plant, fish, etc.), it is reflected and creates an echo. When the sound returns to the transducer, the fish finder calculates the distance between the transducer and the object. It also calculates the strength of the reflected signal. Based on this information, a possible fish, structures such as plants, or the bottom can be displayed on the screen.
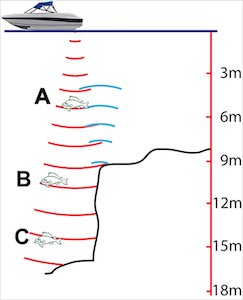
This operating principle is fundamental to fish finders and professional underwater communication. Sound travels underwater at a speed of approximately 1,500 m/s. If the water beneath the boat is 750 m deep, the sound from the ping would take one second to travel down and back up.
These calculations are used to build the sonar image—piece by piece:
All echoes from a ping are first detected by the transducer and then processed by the fish finder. Each echo is assigned a color based on signal strength and displayed in the A-Scope or RTS. These two displays on a 2D fish finder operate in real time. In other words, everything that appears as a colored pixel on them is happening right now. With each new ping, the image shifts to the left and shows us only the past.
That means everything most people look at on a fish finder—namely, the large image—has already happened. Fish being displayed may no longer be there and could have moved on. It is remarkable that what actually interests us—“Where is the fish right now?”—is shown only in the tiny display on the right!
What is alarming, however, is that users sometimes do not even know their fish finder has this display, because on some models, this option must first be enabled in the menu. Many thanks to the manufacturers—for the detailed instruction manuals.
Note: If the shoe fits, wear it. Some fish finder providers do make a genuine effort to do their job well.
Weak and Strong Echoes:
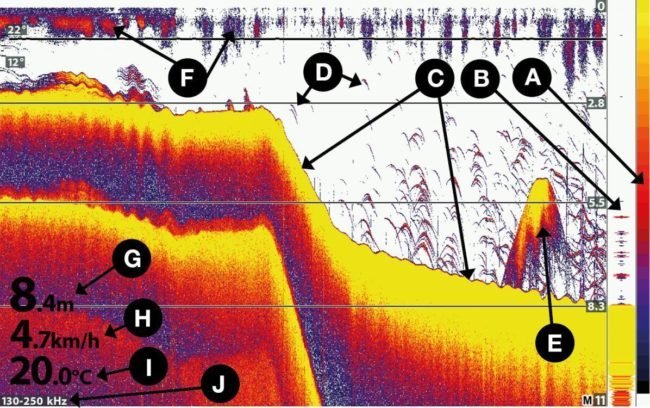
When we look at a sonar image, we see displays in different colors:
- Fish arches may be blue, yellow, red, or a mixture of colors, depending on the color palette.
- The bottom line may be narrow or wide and may be yellow, white, or blue.
- In our image, the color palette (Point A) ranges from yellow (the strongest echo) to dark blue (the weakest echo).
A strong echo is almost always produced by the bottom. The denser, or firmer, the bottom is, the wider the bottom line appears. In our example, a very hard bottom is visible as a wide yellow bottom line. Point C indicates two sections of bottom. The left arrow points to a narrow bottom line (soft bottom), while the right points to a wide bottom line (hard bottom).
There are many differences among fish arches:
Blue fish arches: A weak echo (Point D). This may mean that the fish is quite small and therefore does not produce a strong echo. The fish may also be at the edge of the sonar cone. There, the outgoing sonar signal itself is weaker than in the main cone, so even large fish produce only a weak echo. Fish flesh and bones have almost the same density as the surrounding water. They therefore produce hardly any echo. The air-filled swim bladder alone accounts for 90% of the echo strength.
Yellow fish arches: Fish with a large swim bladder produce a strong echo, while those with a small swim bladder produce a weak one. For this reason, larger perch, which have two air chambers, can often be interpreted as large fish. For example, a larger pike with only one air chamber may appear the same size as the much smaller perch. Yellow fish arches mean the fish is producing a strong echo. Either the fish is directly below the transducer and the strong sound wave produces a strong echo, or the fish is very large, optimally oriented relative to the transducer, and still within the strong outer edge of the transducer cone.
A school of fish, which we can see at Point E, can also produce a very strong echo, because the sound wave cannot penetrate the school of baitfish and is fully reflected. In this case, many small air bladders produce a strong echo.
Red fish arches: You can also see these in the image. They are produced by a medium-strength echo and indicate small to medium-sized fish in the main cone or larger fish in the side areas of the weakened sonar cone.
Tip: Fish finders seem to offer infinitely many settings. With 20% of the settings, you can catch 80% more fish. Learn how to interpret your fish finder correctly with our comprehensive fish finder guide (book)—including the best tips from our 20 years of experience. Or use our video course to become a fish finder expert right away.
How deep is the fish?
The fish finder always shows us the fish's depth. Correct? Not quite. The only depth that the fish finder shows with any degree of accuracy is the depth to the bottom. For almost every fish arch we see in this image, we cannot say at what depth the fish was actually located.
Why is it not so easy to estimate a fish's true depth?
The fish finder's transducer only calculates the time required for the signal and the returning echo. This time is used to calculate the distance to the object, such as the fish. So if we see a fish at a depth of 7.5 meters on a fish finder, all we know is that it is 7.5 meters from the transducer. We do not yet know whether it is 7.5 meters below, to the left, to the right, in front of, or behind the boat.
Why, then, is the bottom depth correct?
The bottom line is formed from the strong echoes of two to three pings. Because the strongest signal is always produced by a direct reflection, the strongest echo almost always returns from the bottom directly beneath the fish finder. There are exceptions to every rule. Accordingly, over rugged bottom terrain, the bottom reading is not accurate either.
Can we really never determine a fish's depth?
Yes, we can—because here are three signs that the fish is directly beneath the boat.
- The fish is on the bottom: In this case, we can assume it is actually directly beneath the boat. If it were not beneath the boat, it would be swallowed up by the bottom line and no longer displayed.
- Fish directly beneath the surface: Fish in the upper water column pass through the narrowest part of a sonar cone. They therefore almost always cross the strongest part of the sound cone.
- Fish displayed in the strongest color: Look at the large, thick fish arch in the image. Its tip practically glows. If we compare the fish arch with the color palette (on the right in the A-Scope), we see that it is the strongest echo. For this reason, there is a high probability that the fish is not only large but is also almost directly beneath the boat at a depth of 7.5 meters—or rather, was there—because it can only produce such a strong echo from this position.
To illustrate that the fish finder measures only the distance to the fish, not its current position relative to the boat, we have also shown the principle in a graphic. Both pike in this example are 7.5 meters from the transducer. To us, they would appear as two fish arches at the same depth on the fish finder screen. They would effectively overlap.
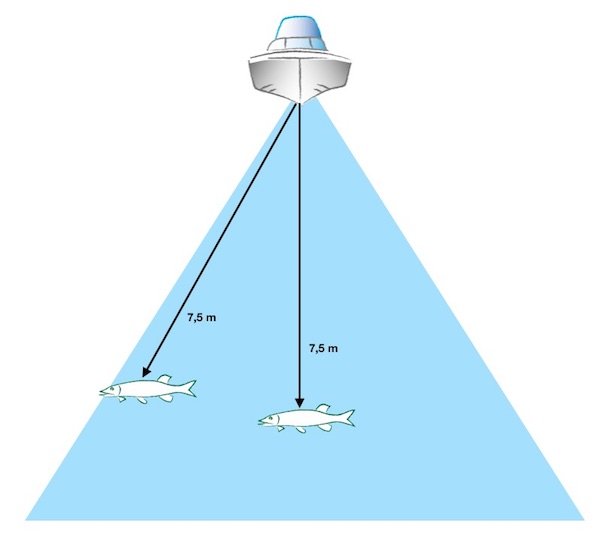
However, the fish arch at the outer edge would probably be displayed in a weaker color. The question you now need to ask yourself is: When you see two large fish arches overlapping on your fish finder screen, can you interpret that the fish are not necessarily swimming at the same depth or occupying the same location underwater?
Facebook group for your sonar images: Join our Facebook group, “Interpreting Sonar Images Correctly & Catching More Fish.” Here you can upload your sonar images, ask questions, and have them analyzed. Join the Group
The fish dives:
Back to the Table of Contents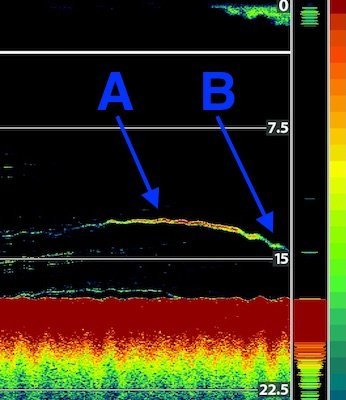
Who has not seen this image? A fish appears to be diving. In our image, the fish changes its depth from just under 11 meters (A) to 15 meters (B). It is shooting 3 meters downward, right?
Wrong—the fish is not necessarily diving; it is merely moving away from the transducer. It only appears to be diving because a 3D image of the underwater space cannot be shown on the fish finder's 2D screen. At least not in this display.
The main clue that lets us correctly interpret the movement away from the transducer is the change in the fish arch's color. It changes from red (= strong echo / Point A) to green (= medium-strength echo / Point B). This is a clear sign that the fish is moving away—perhaps startled by our motor—and the echo is therefore becoming weaker. It is also impossible to determine the direction in which it is disappearing.
How Do CHIRP and Conventional Sonar Differ?
Back to the Table of Contents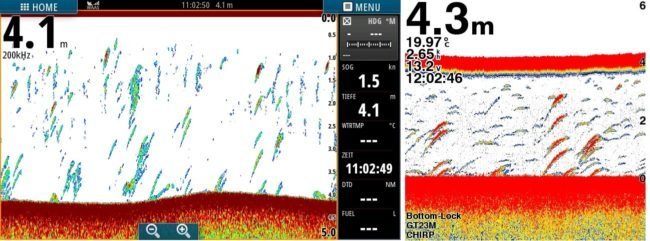
As we have already described in our book “The Comprehensive Fish Finder Guide,” clearly identifying echo signals is often a challenge. Fish arches are often displayed indistinctly or too coarsely. However, the better the technology, the better the results will be.
Traditional 2D sonar images are not always easy to understand. Clouds of fish (baitfish), underwater plants, and boulders are often difficult to distinguish adequately. It is not uncommon for one object or another to remain a mystery because you have no idea what it might be. Then there is the unfamiliar viewing direction from right (current) to left (already passed), which takes some getting used to.
You can avoid this guessing game with the latest technology and scanning methods. To significantly improve target separation and increase resolution fivefold, simply use a CHIRP unit combined with a full-CHIRP transducer.
The two sonar images shown above indicate just how substantial the differences can be. They were recorded simultaneously with a Simrad Go7 at 200 kHz (left) and a Garmin Echomap 52cv with a CHIRP transducer (right). As the image shows, a true CHIRP transducer substantially improves the detection rate.
What Do Photorealistic DownScan Images Show?
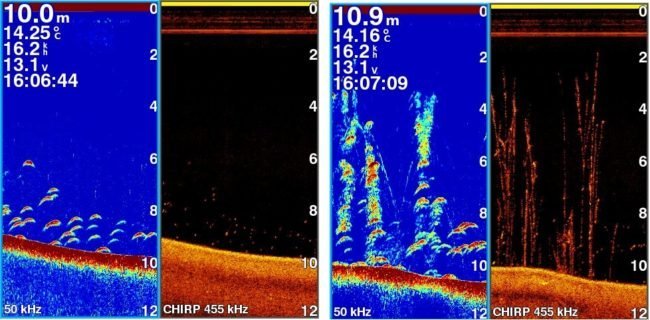
Fish arches on the 2D display (blue background) are not always fish. Obstacles are often behind the arches. However, these very obstacles are true hotspots for smaller fish because they provide food and shelter. Predators therefore regularly make feeding runs to these hotspots. If you fish here at the right time, you may hook a predator such as a pike or perch. With the right fish finder and appropriate settings, you can easily identify these hotspots.
You split the screen on your fish finder. Alongside the 2D view, you also select the DownScan image. This often provides immediate clarity about the underwater environment. In the 2D sonar image (left), you might suspect fish and underwater plants. The DownScan image (right) provides certainty. A closer look also confirms the fish (bright dots in the plants), eliminating any uncertainty.
Our private Facebook group “Interpreting Sonar Images”—you can become a member here.Can GPS help you find hotspots faster on unfamiliar waters?
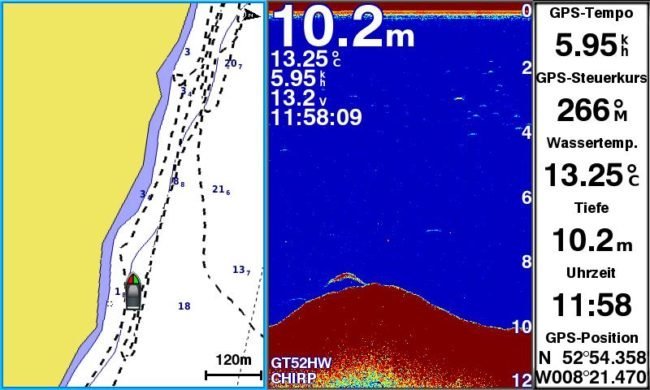
Let us answer this question with a practical fishing experience
It is October, during the best time for zander, and you are visiting a large inland lake for the first time to target your favorite fish. Your first look should be at the bathymetric lake chart (fishing chart) on the chartplotter, with the aim of quickly finding promising areas and spots based on the underwater terrain. In our example, this is the sloping area on the left, which drops to around 20 m.
Plenty of baitfish can be expected near the shore, so smaller predators weighing up to approximately 8 pounds may be holding along the first break. In early fall, the large specimens would be expected during the day in deeper areas around 10 m (“Modern Fish Finding—The Zander (German-language edition; English edition coming soon),” Chapter 8.4.9). You now focus exclusively on this area and cover it at a slow trolling speed. While fishing, the fish finder is set to the frequency with the widest transmission cone (or Mid CHIRP) to scan the largest possible area while trolling.
The first trolling track along the 7 m break was already successful, immediately producing two specimens weighing four and seven pounds. On the second track route (10-15 m), individual large predators were spotted on the sonar image and then targeted specifically (deep-diving crankbaits, trolling depth approximately 6 m / sonar image on the right). As a result, we hooked two full-grown specimens in two days.
SideScan—or: “Where exactly is the fish really located right now?”
Back to the Table of Contents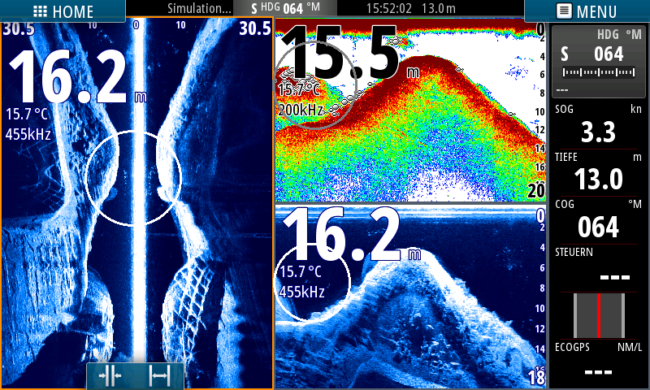
When you see a fish arch on your 2D sonar image, you have already taken the first step toward finding the fish. But even if the fish finder indicates that a big one is beneath the boat, a 2D fish finder still does not tell you which side it is on. Many fish finder users are unaware of this fact.
Depending on the depth and settings, the fish may be several meters to the left, right, in front of, or behind the boat. For example, if the fish finder uses a 60° cone angle, a fish that appears at a depth of 10 meters and forms an attractive fish arch could easily be either 10 m to the left or 10 m to the right of the boat. At a depth of 10 m and with a 60° cone angle, the sonar cone covers a full 104 sq m!
Anyone unaware of this fact will probably make many unsuccessful casts before eventually giving up in frustration.
The question of where the fish is located can either be narrowed down using a few strategies or answered quickly and reliably in still water by combining SideScan technology with the 2D fish finder. For success when pelagic fishing, knowing the fish's exact location beneath the boat is immensely important. In the example shown, I set the display to fish symbols to make them easier to distinguish at this magnification.
Although this display is not as reliable, the fish stand out better against the terrain here than fish arches would. With this method, however, keep in mind that the scan areas of 2D, DownScan, and SideScan differ and therefore do not necessarily show the same conditions simultaneously. For example, the DownScan image depicts only a very narrow area in the direction of travel, so fish may appear on the 2D image before appearing later on DownScan. In this example, the fish population can be seen in all three images, while SideScan indicates the exact position relative to the boat. With the right fish finder, you can mark the fish and navigate to it precisely using GPS.
Tip: Read our detailed fish finder test here.
Remember: The fish finder is one of the most expensive pieces of fishing equipment. Only if you know how to use it correctly and effectively can you target hotspots. With the right knowledge, you will not only get more from your equipment and greatly increase your actual fishing time—you will inevitably also have a substantial increase in fish in the cooler.