
UNDERSTANDING WATER · BEFORE THE FISHING DAY
How do you read depth contours to turn a map into a sensible first fishing spot?
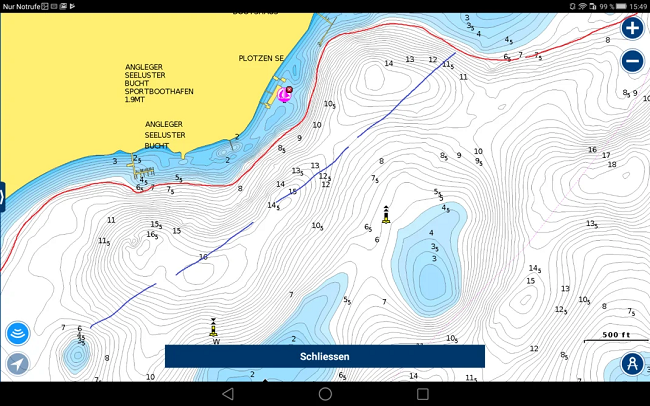
What do depth contours on a waterbody map really show?
A map does not reveal all of a waterbody's secrets. But it eliminates the initial guesswork. On a large gravel pit lake, reservoir, or wide river, there are often many hectares of water between two accessible shoreline spots. Depth contours give you an overview: Where does the bottom drop off? Where does a channel run? Where does a plateau end? Where is there a shallow ridge between deeper areas?
Fish are not interested in the contour itself. What matters is what the feature can provide: a transition from shallow to deep water, a travel route for forage, a protected refuge, or an area where food and cover come together. Good map reading therefore does not begin with the question “What depth produces fish?”, but with “What connection might make sense for my target species today?”
The numbers on the map usually refer to a specific chart datum or gauge datum. Water level, sediment, new obstructions, and the spacing between survey tracks can cause the actual depth to differ. Therefore, use the map as a guide, not as a substitute for awareness, depth sounding, or safe navigation.
What does narrow or wide spacing between depth contours mean?
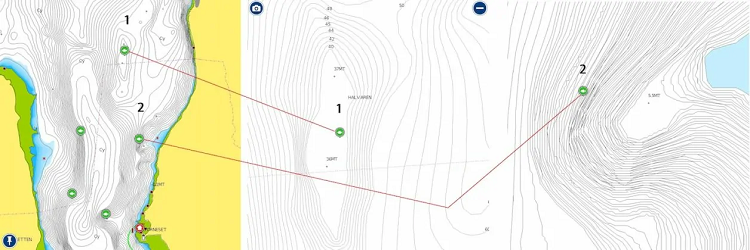
Closely spaced contours often mark a rapid transition. This may be a drop-off, a channel, an underwater slope, or just a short, steep section. Widely spaced contours describe a more gradual slope: a flat, a gently sloping shoreline, a gradual bank, or a shallow plateau. Only by looking at multiple contours can you tell whether you are seeing a single drop-off, a long slope, or an enclosed feature.
Contour spacing must always be considered in relation to the scale. On a low-resolution map, a seemingly dramatic drop-off may have been created from only a few survey points. On high-resolution maps, many contours can create a cluttered image even though the bottom remains easy to interpret in practice. First zoom far out to understand the waterbody. Only then zoom in on your two or three most promising areas.
Steepness is not the only important factor. An unremarkable drop-off at the transition between a weed bed and deeper water can be more valuable than the steepest drop into an empty basin. Always look for the combination of feature, connection, and reason: Where are the fish coming from, where might forage be holding, and why should there be movement along this route right now?
Which map features can help you find fish?
- Drop-off or ledge: connects shallow and deep water. Check not only the drop-off itself, but also its upper edge, base, and lateral extent.
- Plateau: a shallower area surrounded by deeper water. It can provide food, baitfish, or hunting grounds—its edge deserves an especially close first look.
- Channel: an elongated depression or former watercourse. In a lake it can serve as a travel route; in a river it must always be interpreted together with the current.
- Underwater hump or ridge: rises from deeper water. The windward side, steep edge, and connection to a larger deep-water area are often worth examining.
- Bay and inflow: the feature alone is not enough. Temperature, wind, inflow, vegetation, and its connection to open water determine whether it holds forage today.
A good starting point is rarely a single map pixel. Instead, mark a section—for example, the beginning of a drop-off, its windward side, and the transition to deeper water. This lets you compare areas on the water instead of fixating on a supposedly magical GPS position.
How do you turn a depth map into a fishing plan?
Start at home with the overall shape of the waterbody. Mark three different options rather than ten spots—for example, a windward drop-off, a sheltered bay with access to deeper water, and a plateau near a channel. Give each area a reason. “Drop-off at eight meters” is not one. Better: “The wind pushes food against the shallow edge; the adjoining drop-off gives perch and pike a route into deeper water.”
Once on the water, check whether your assumption holds up. Has the wind shifted? Is the water there clearer or murkier than expected? Are baitfish visible along the shore, in open water, or on the fish finder? Is there no activity at all? If so, do not switch lures at random; compare the next bottom feature instead. This teaches you which combination of conditions works on your waterbody.
For perch, open water, a drop-off, and the depth of the forage may be interconnected. Also read Perch locations throughout the year. For pike, a weed edge, plateau, and adjacent deep water can form a travel route; start with Where are pike found?. On a river, the map tells only half the story—the current determines how much energy a spot costs the fish. The article on river zander fishing adds that perspective to the map.
What errors can maps and depth contours contain?
Many digital maps smooth or interpolate between recorded depths. As a result, a contour at the edge of a surveyed area may be less accurate than one in the middle. Shore zones, reed edges, shallow areas, and places with few survey tracks require particular caution. A map also cannot reliably show whether timber, weeds, rocks, mussels, or soft mud are present on the bottom.
The best approach is: map first, verify afterward. If you are boating, compare the expected bottom profile with your fish finder, GPS track, and personal observations. If you are fishing from shore, assess casting distance, wind, visible drop-offs, the weedline, and accessible depth. Regardless, boating and safety rules as well as local boating and fishing restrictions always take precedence over the desire to inspect a spot more closely.
Can you also make effective use of depth contours from shore?
For shore anglers, the most important question is not “Where is the deepest spot?” but “Where does a useful feature come within casting range?” A drop-off running close to shore, a point with a drop on one side, the mouth of a ditch, or the outside bend of a river can be more valuable than a deep basin far beyond casting range.
Fan your casts: first parallel to the possible drop-off, then diagonally across it, and finally to its base or deeper end. This tells you which part of the feature produces bites. Do not change casting direction, lure size, and retrieve simultaneously—otherwise, you will not know what made the difference.
What sequence will help on your next fishing day?
- Assess the waterbody as a whole: Mark deep basins, shallow bays, channels, drop-offs, and possible connections.
- Justify three areas: Not “because the map looks good,” but because of a logical connection among structure, depth, and possible forage.
- Add current conditions: Wind, water level, turbidity, temperature trend, and seasonal phase reprioritize the areas.
- Look for forage: Visible activity, baitfish, birds, weeds, and fish-finder images confirm or disprove the hypothesis.
- Fish the structure methodically: Deliberately distinguish among the upper edge, slope, base, and lateral extent.
- Record the result: The location, casting angle, depth, conditions, and contact give you a real head start on your next fishing day.
A depth map is neither a lure catalog nor a promise of a catch. It is your tool for asking better questions before the first cast. If you narrow a large expanse of water down to three plausible sections, you are already fishing with greater focus—whether you spend only a few days or many days on the water.
Source basis and reuse: This article further develops the technical sections of the existing, detailed article on maps and waterbody maps. Two original graphics were reused in contextually appropriate places. Brands, app prices, and specific product features are deliberately excluded from this foundational article; they belong in future technology and review articles.